Fortis AES Central Plant | Vancouver, BC | 2019 - Present
In my experience, clarity is often mistaken for simplicity. When tasked with creating a user interface that accommodated both advanced and fledgling user, it was important to provide clarity above all else, even with the risk of leaving simplicity behind. The central plant providing both heating and cooling for two large scale office and residential towers in downtown Vancouver was anything but simple. With 5 industrial chillers and 3 heat exchangers, 3 mixing headers, a multitude of heat exchangers and pumps with variable speed drives, my approach was to stay as close to the original schematic drawings from construction, instead of providing the normal multi-page approach I have seen from over thirty years of BAS drawings.

The inherent shortcoming of showing a large central plant through multiple views (chillers on one page, heat exchangers on another, etc.) is that the user loses context of the system as a homogenized whole of diverse parts. For example, slowing down pumps that serve one of the chillers will inherently affect the heat exchangers on the other side, and may not be flagged as an issue because different operator teams serve each tower at any given time. So fixing an issue on the cooling side potentially introduces another issue on the heating side of the neighboring tower.
When it comes to BAS graphics, there is not a lot of choice when it comes to visualization tools, mainly because most of North America uses one of the very few archaic software platforms that accommodate BAS data. While recent buzzwords like IoT have been making the rounds for the last couple of years, there is really not much choice when it comes to linking live building data to web graphics, much less responsive front end that can serve both desktop and mobile touchpoints. Extensive testing was done to enable my original vision of a single graphic able to show the whole system with enough clarity but would not cause the operator's workstations to bog down or even worse, crash.
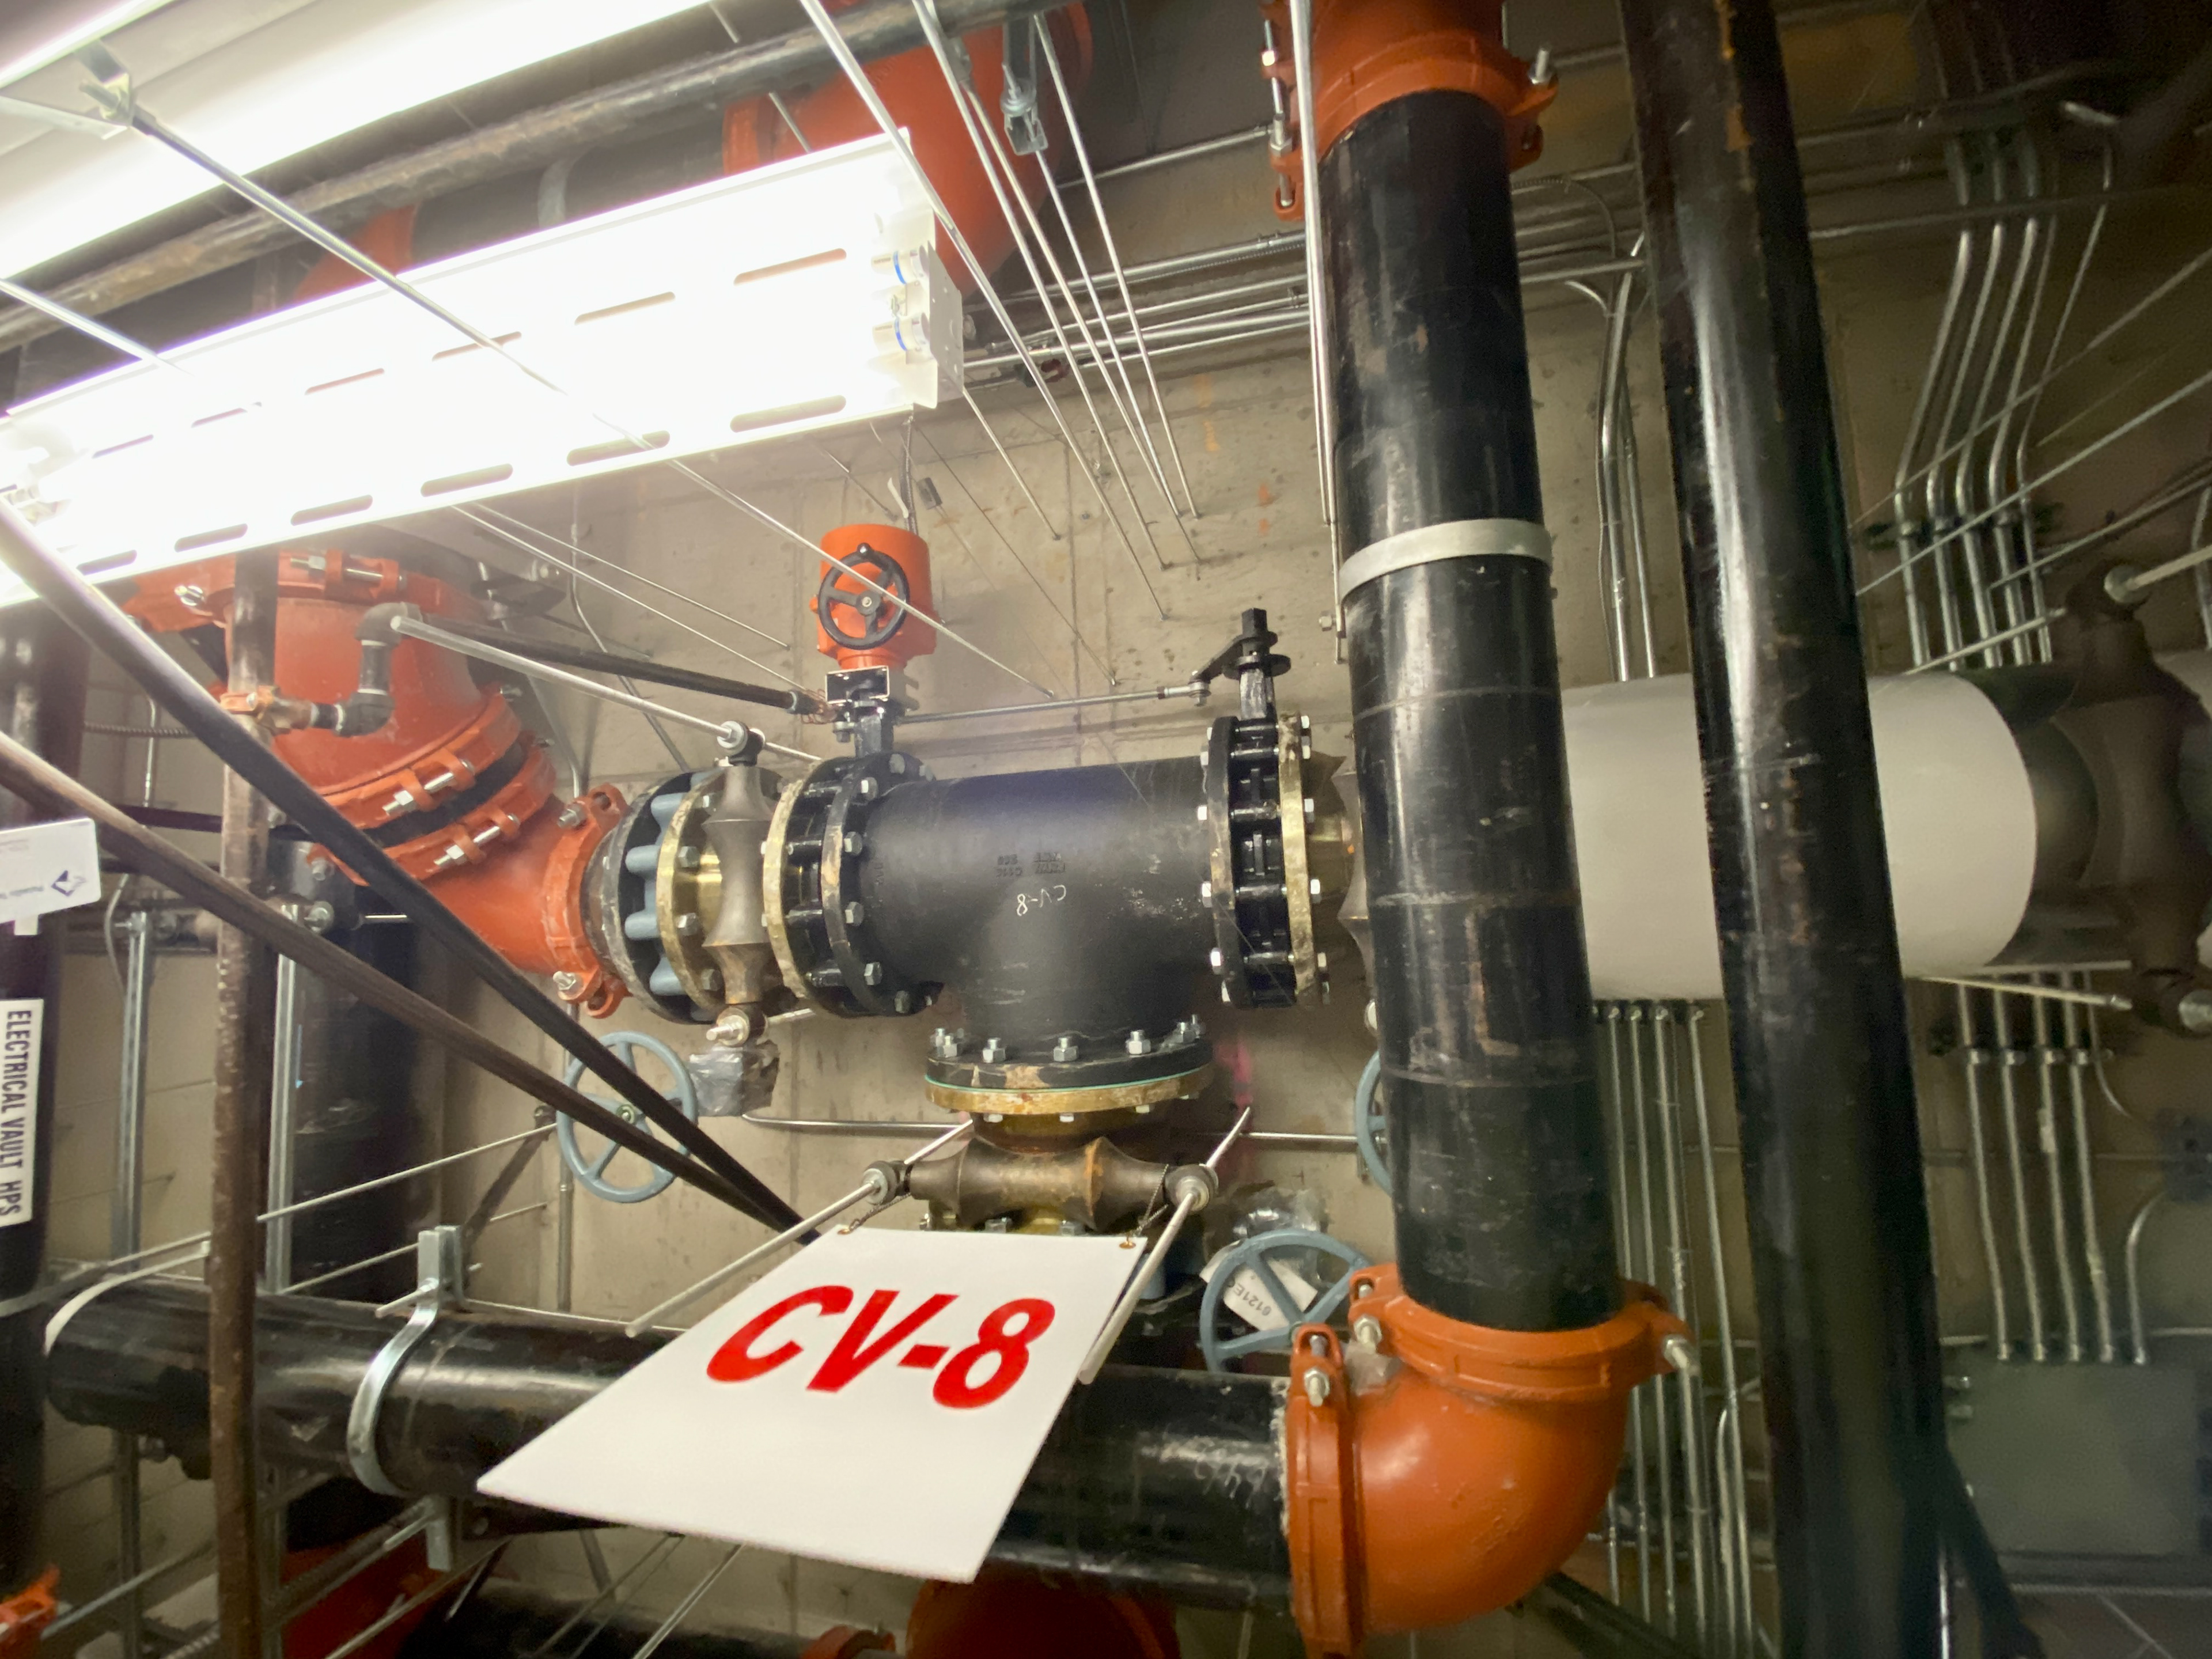
I created the graphic layouts and equipment artwork in Figma, working with the operators to validate each pipeline, pump, sensor, and everything else in the system. Object animations were done in SVG format, then imported into DGlux to connect live data from BAS controllers to activate animations and populate text values. This is easily the most complex central plant UI I have ever attempted. I am still actively developing some parts as the system constantly keeps getting sections upgraded and replaced (energy meters, pumps, VFDs).
Front-end development, graphics and UI created by AC.

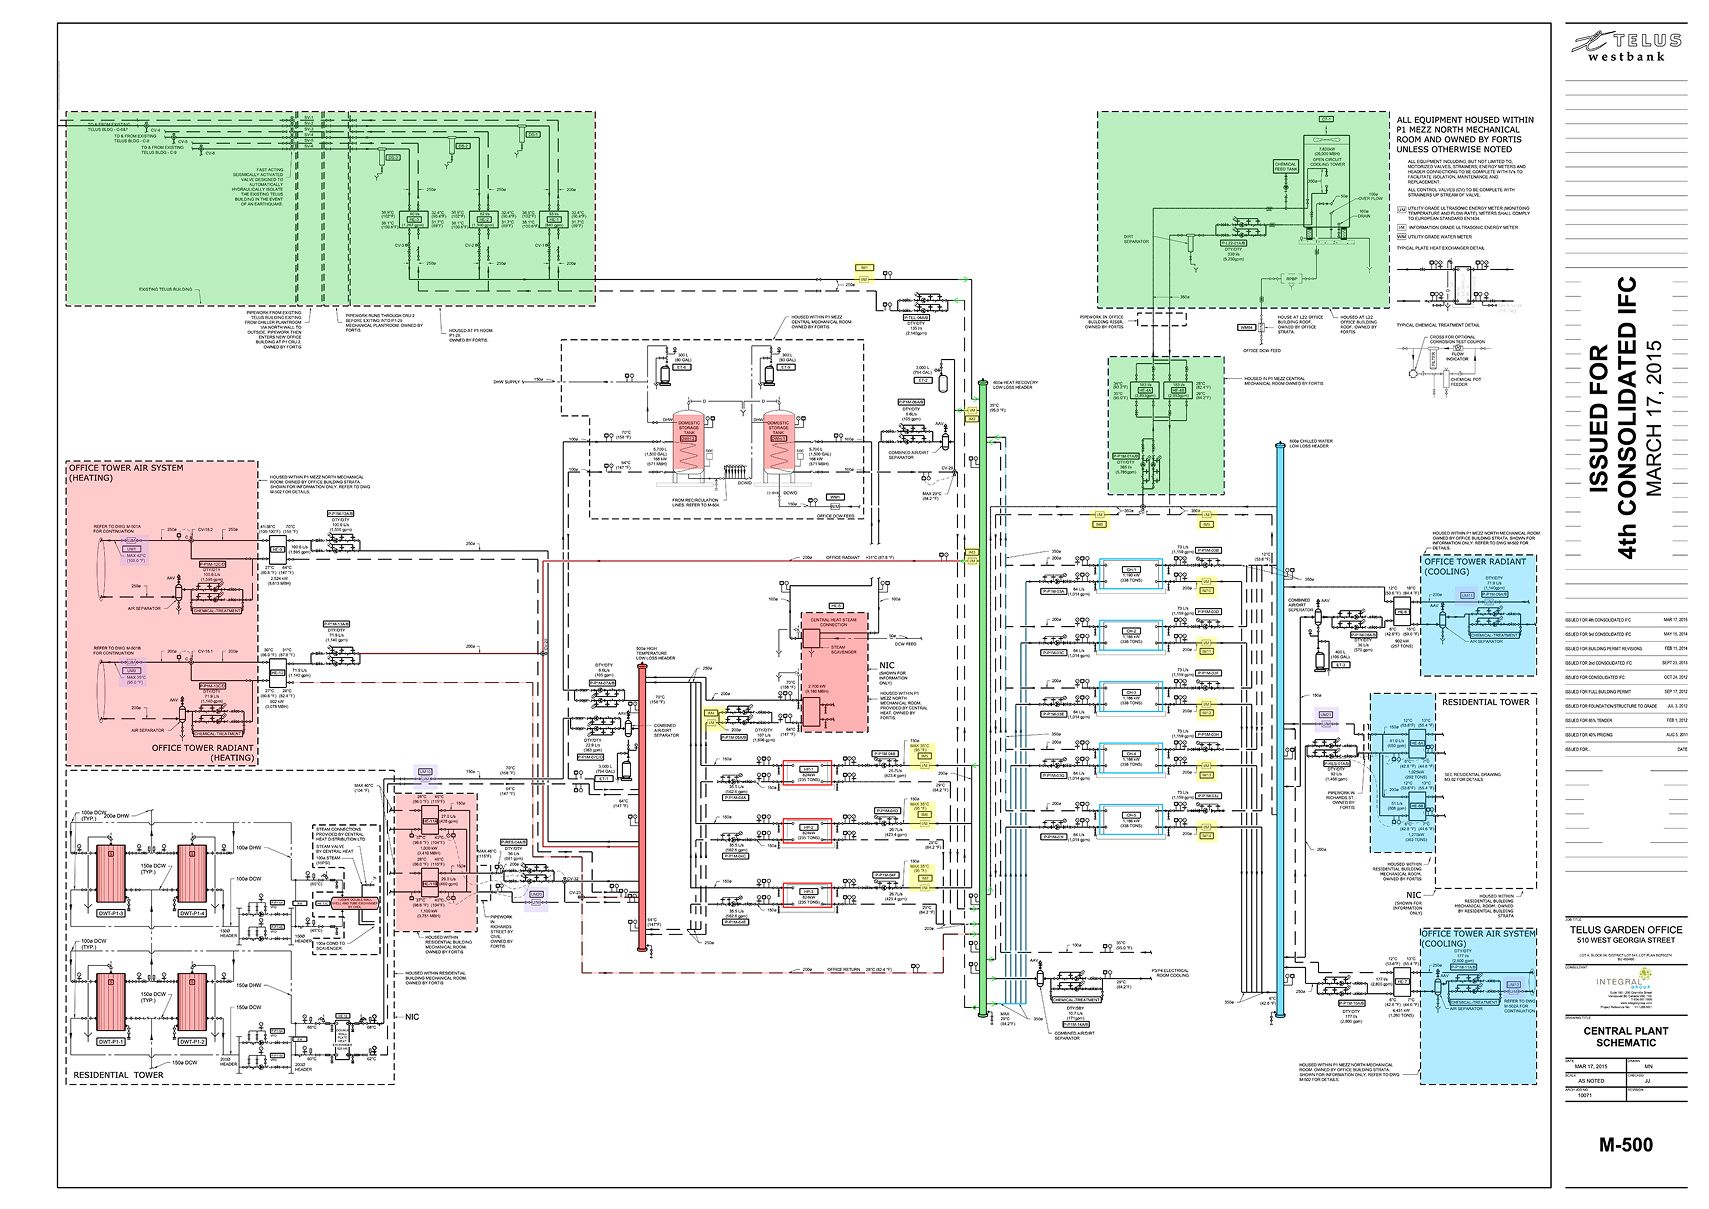
IFC drawing for central plant from consultant showing major system subdivision.

Graphic library of components for layout and animation. Created by AC.

Figma layout of central plant graphic, 12000 x 6000 px.
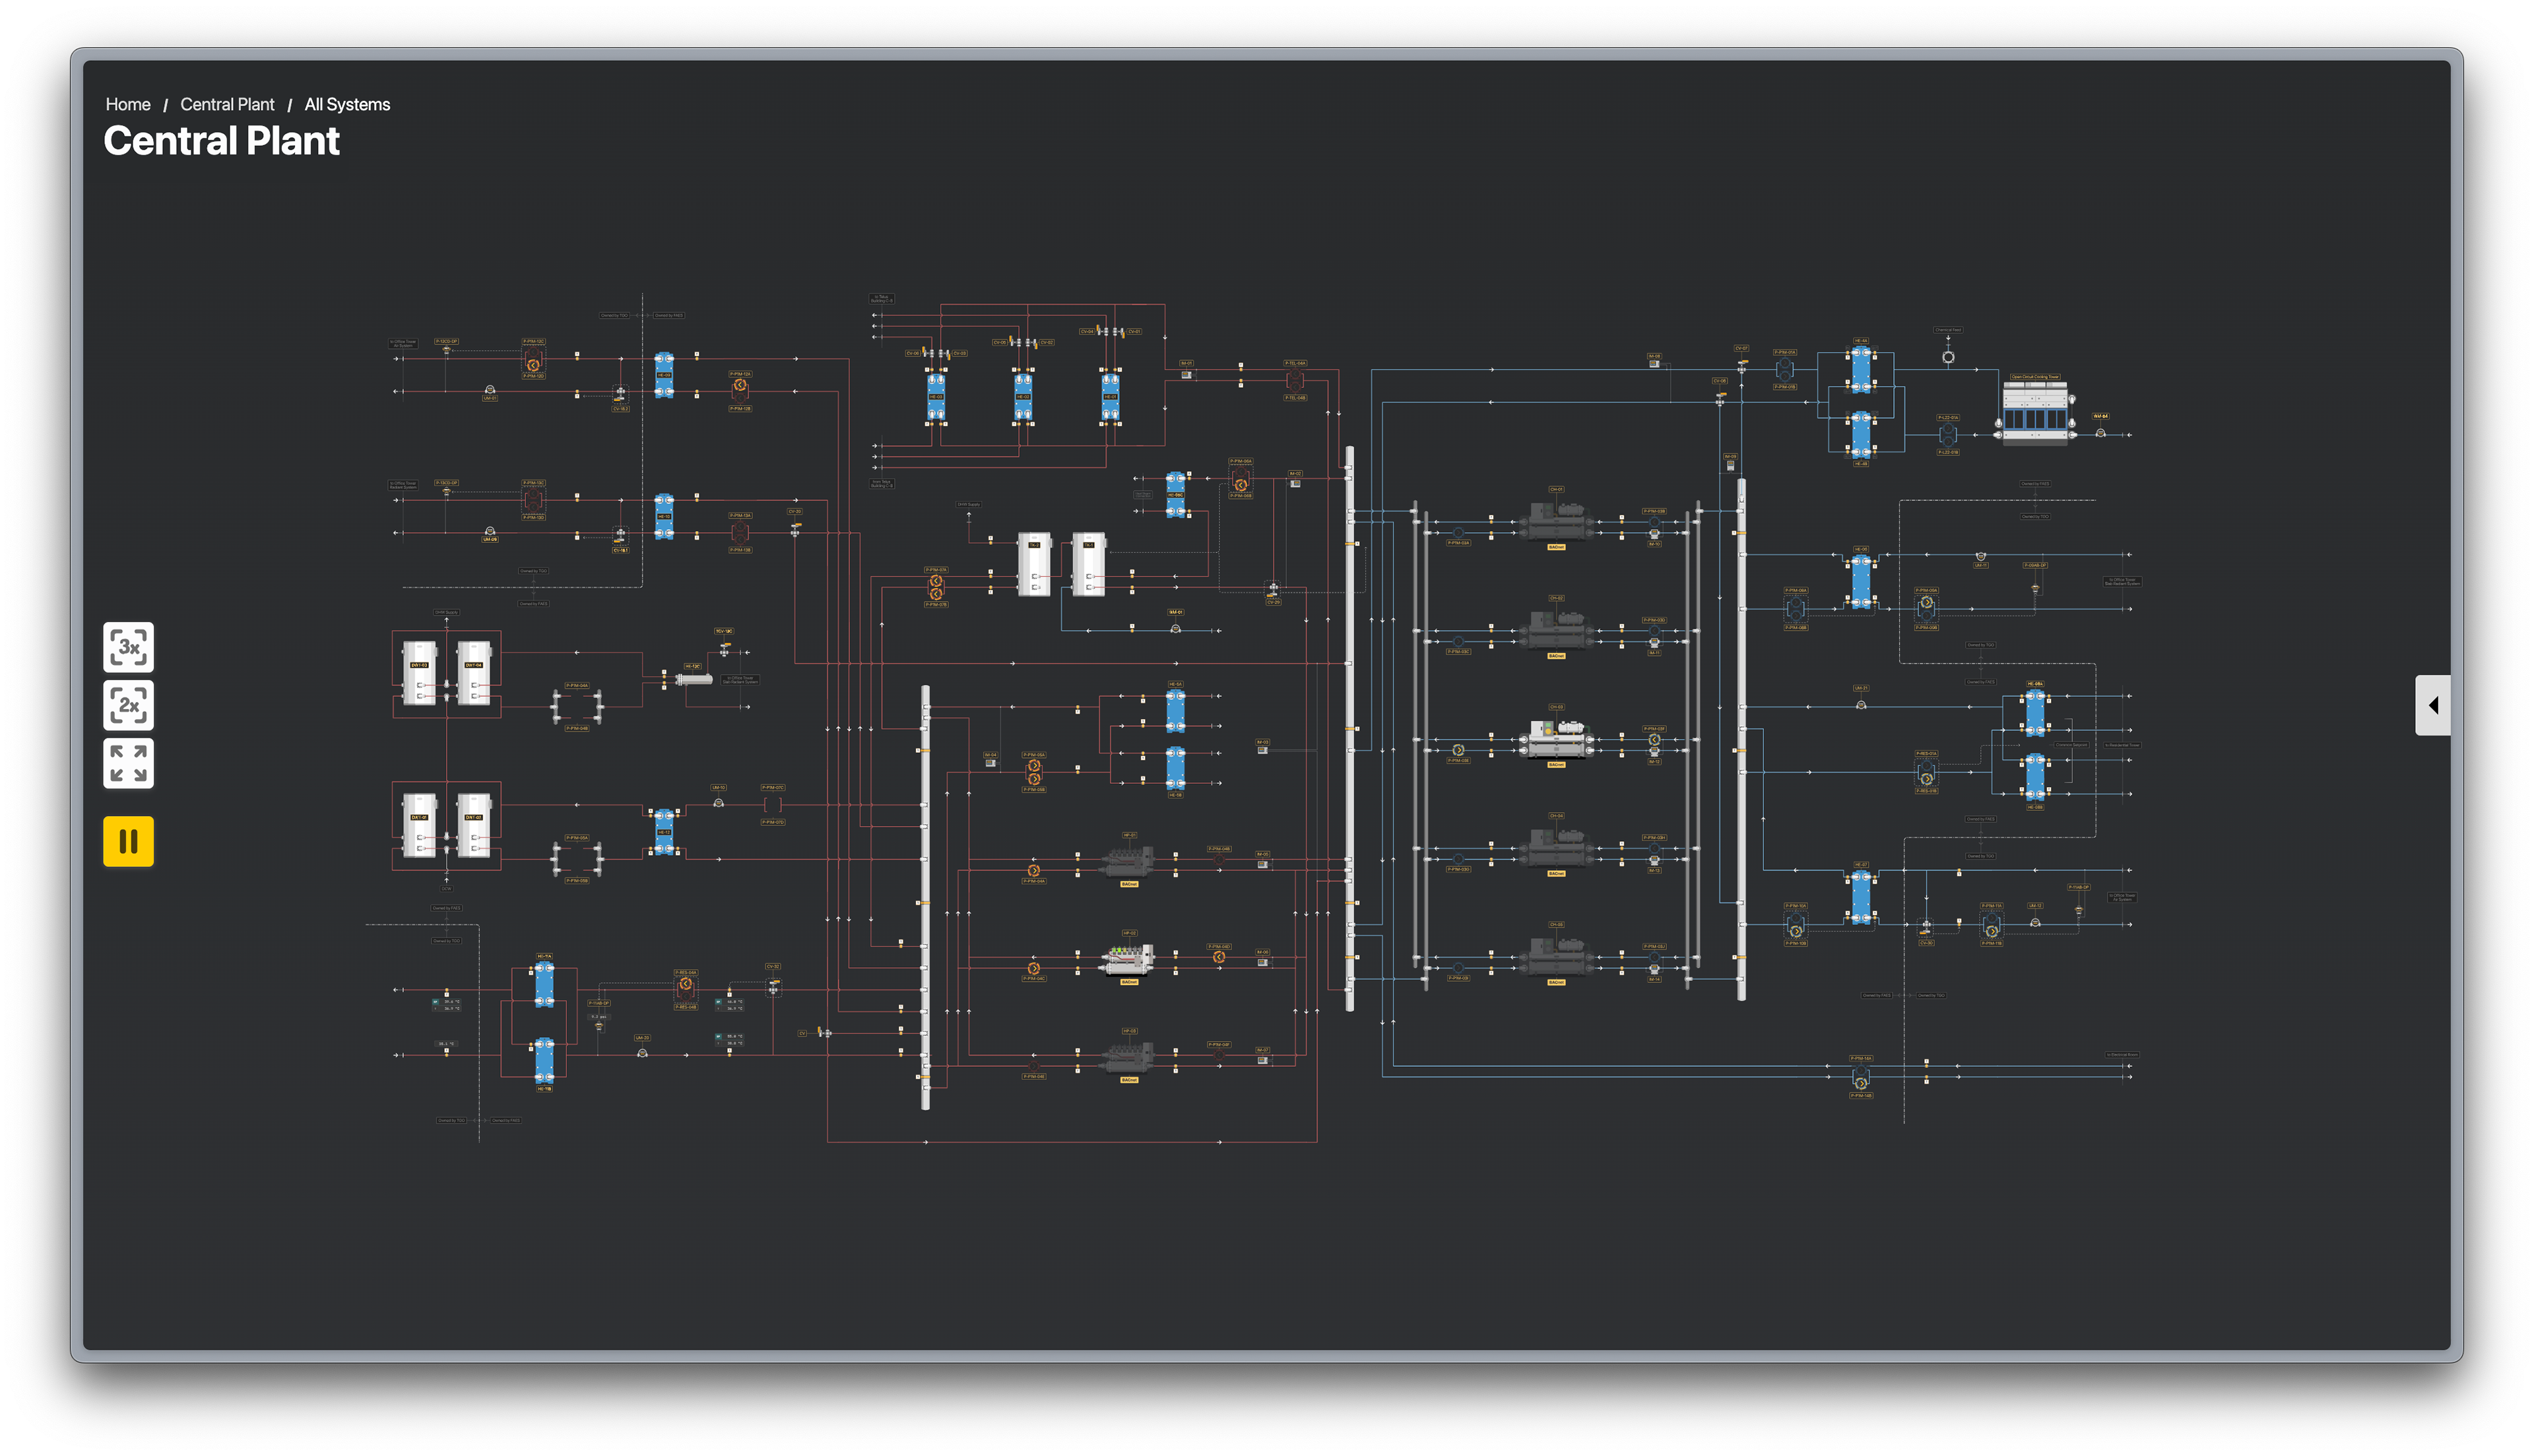
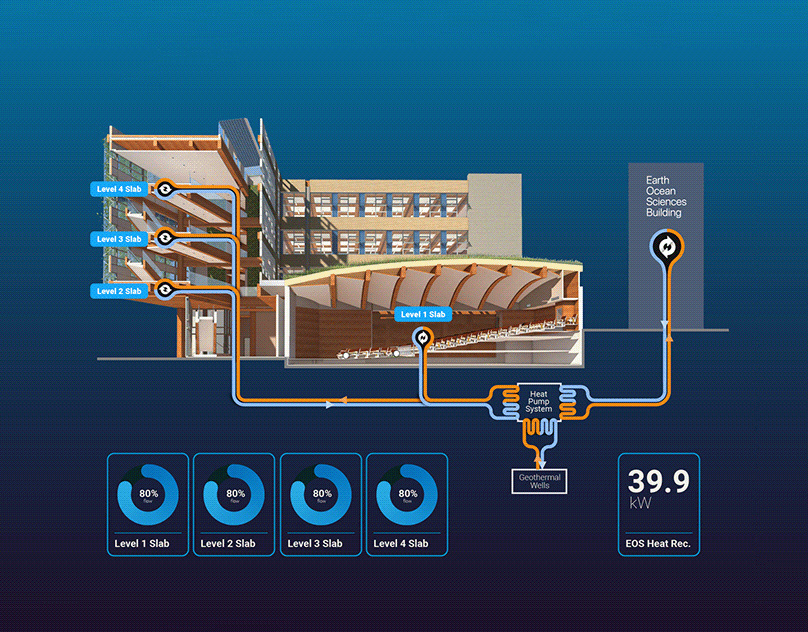
Screen capture of live graphic: whole system @1x view (no animations activated)
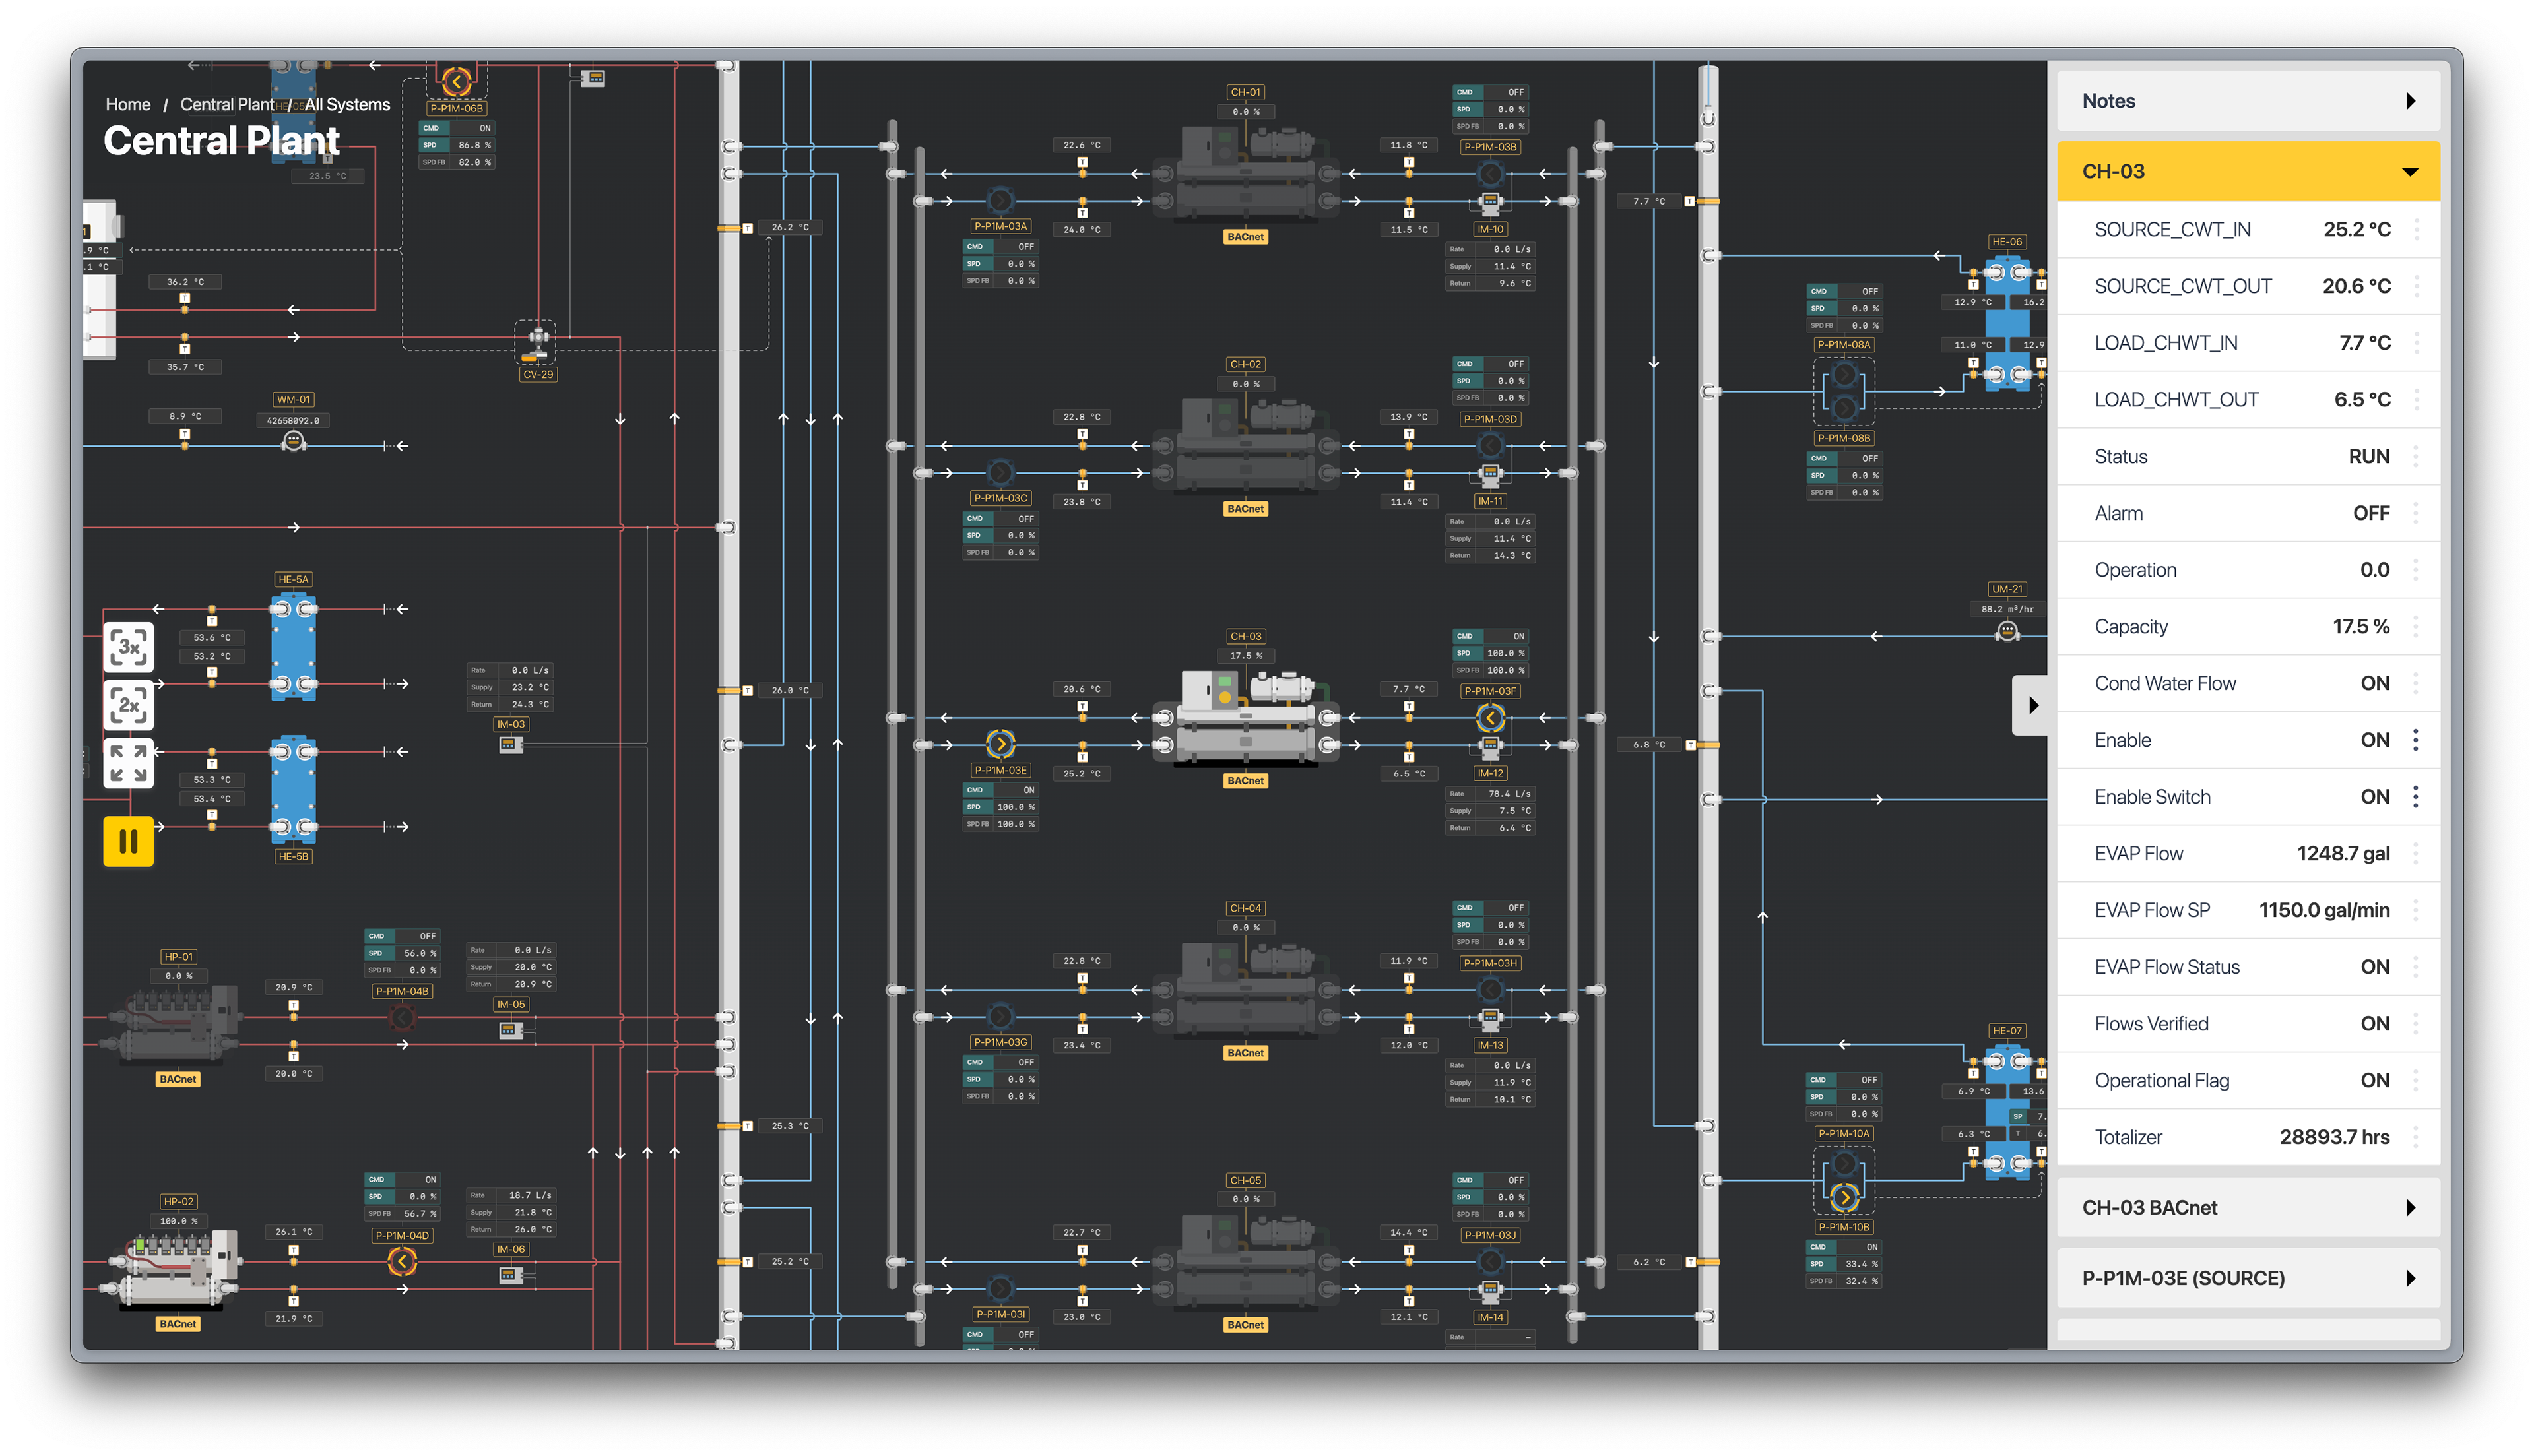
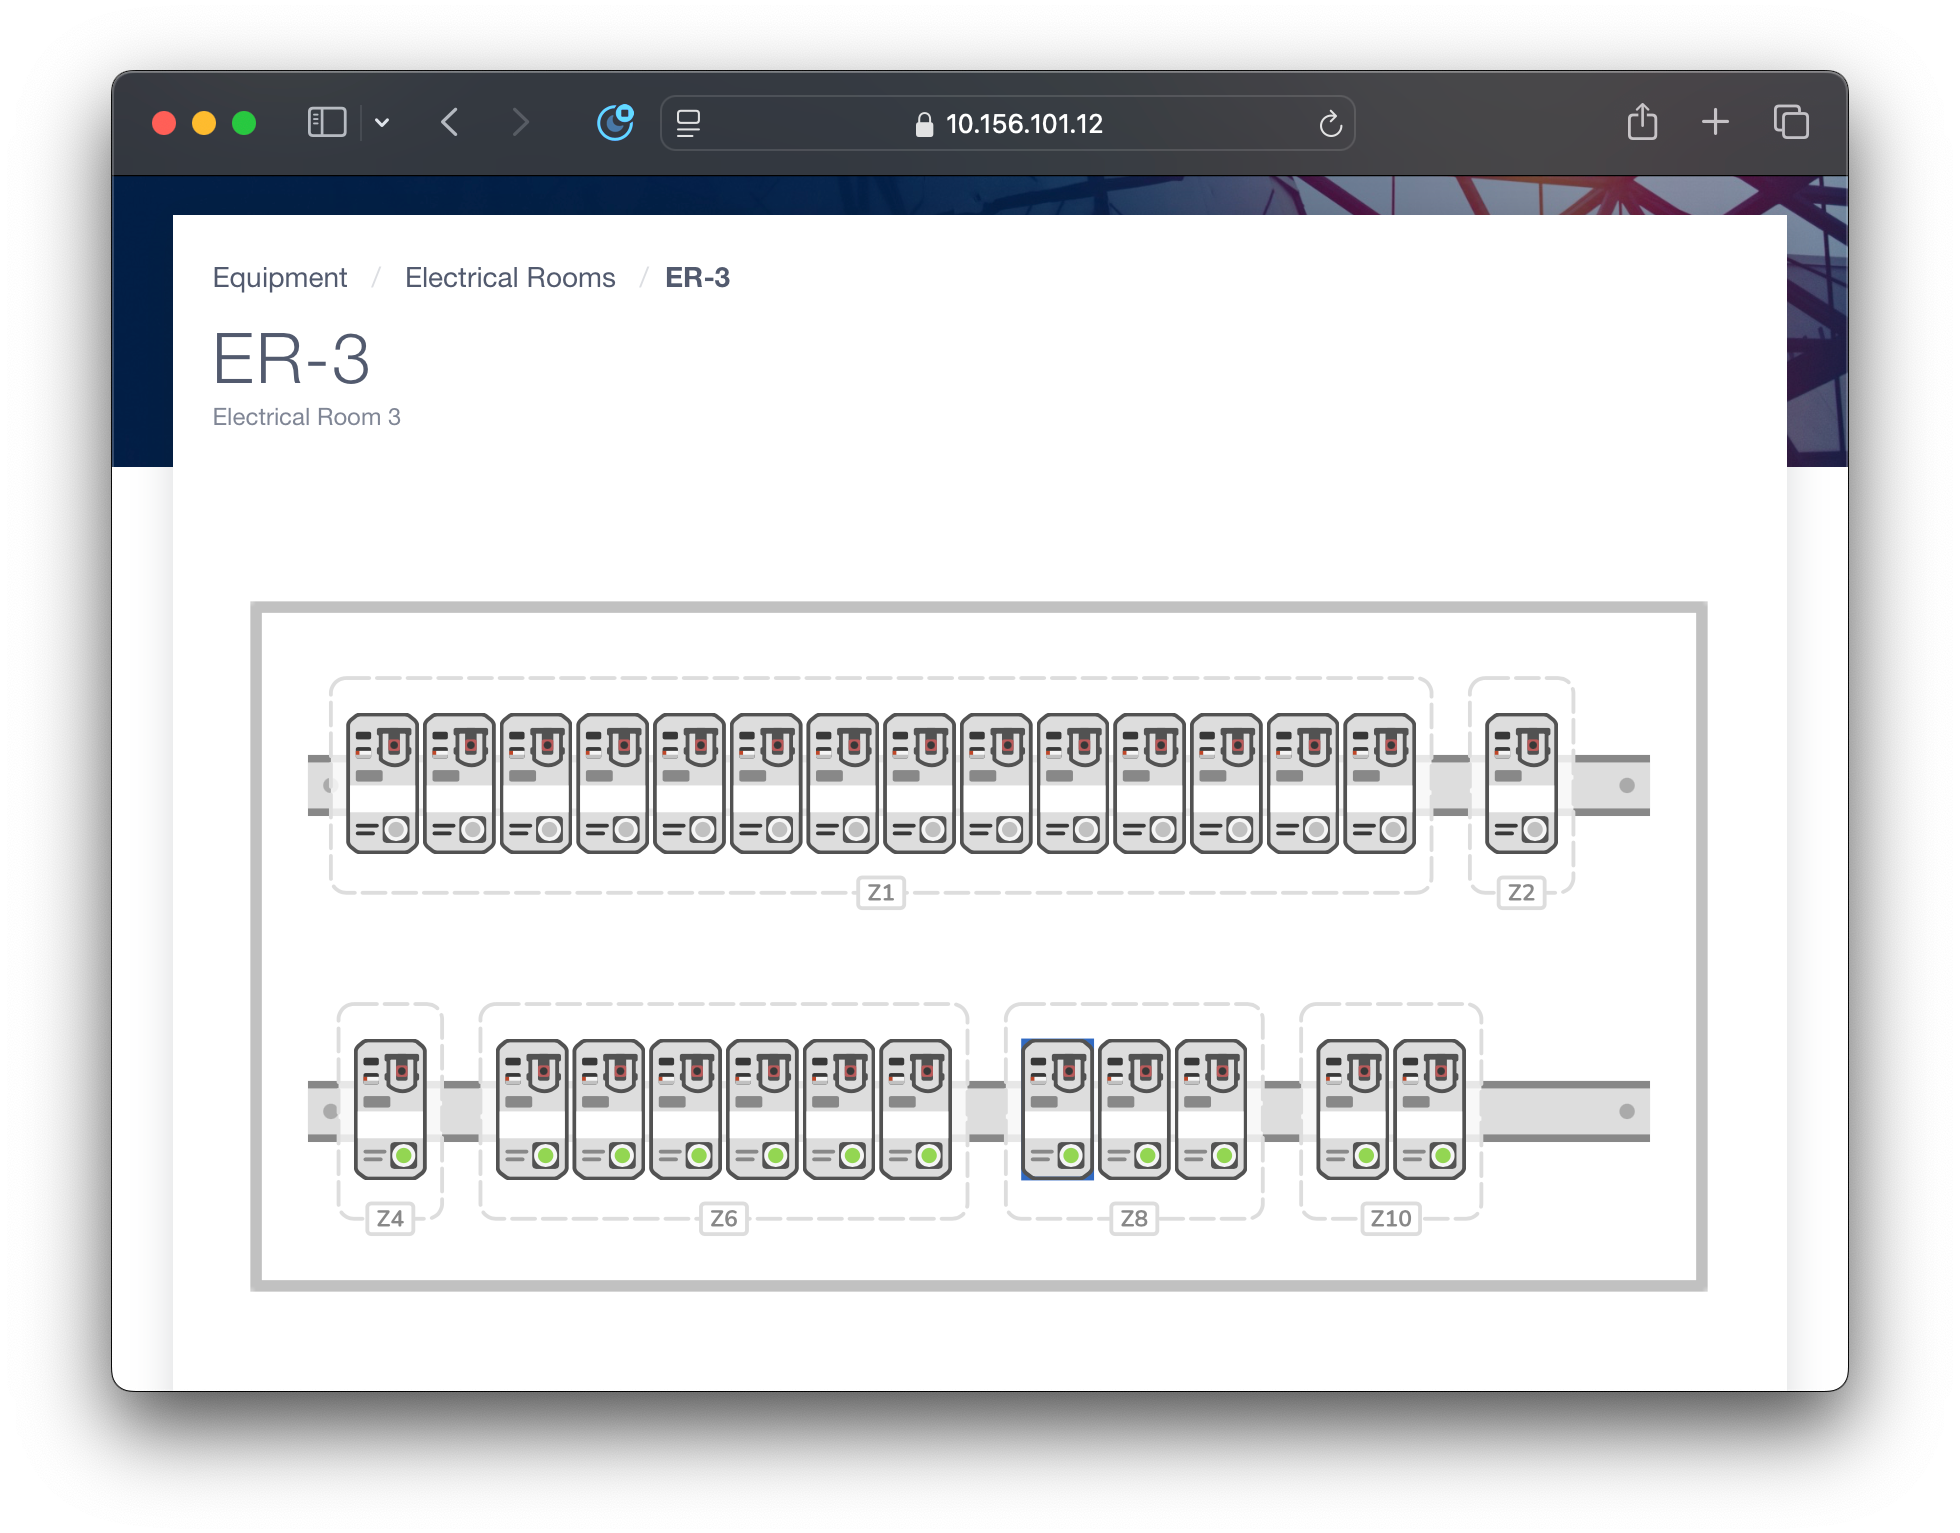
Screen capture: @3x view. Chiller 03 control points shown on right

Screen capture: @2x view, cooling side of central plant showing cooling tower and heat exchangers
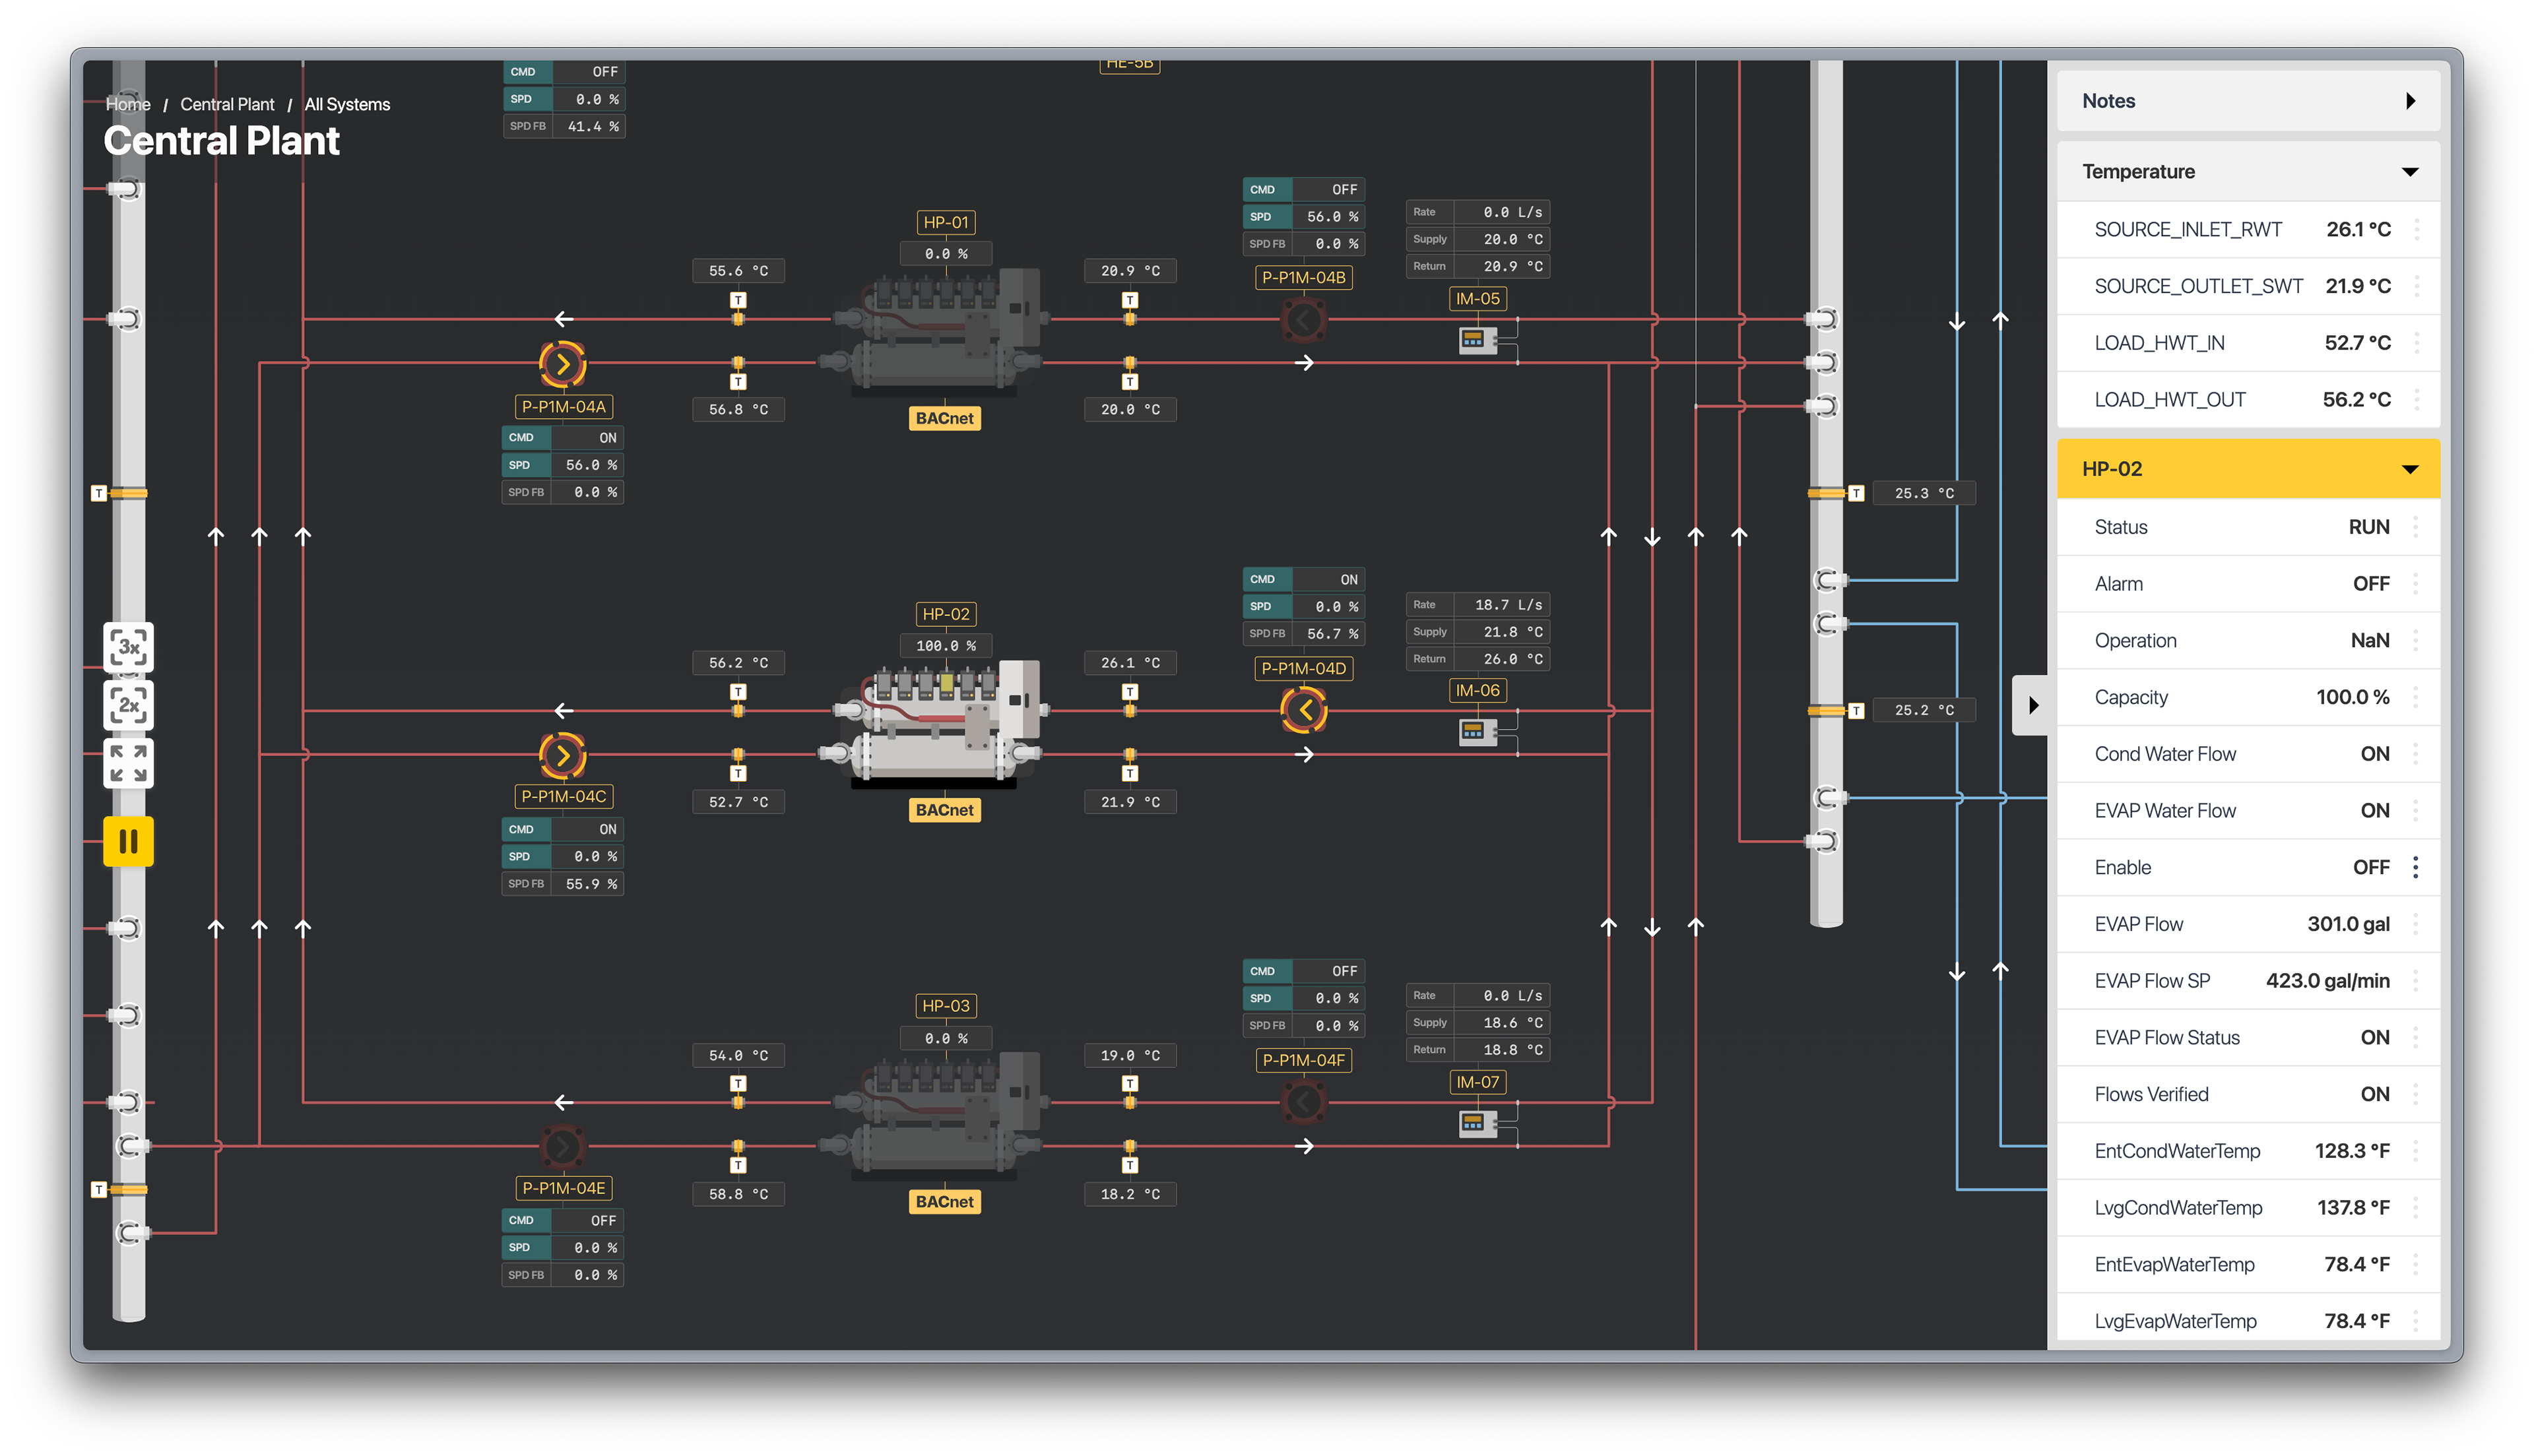
Screen capture: @2x view, heating side of plant showing heat pumps
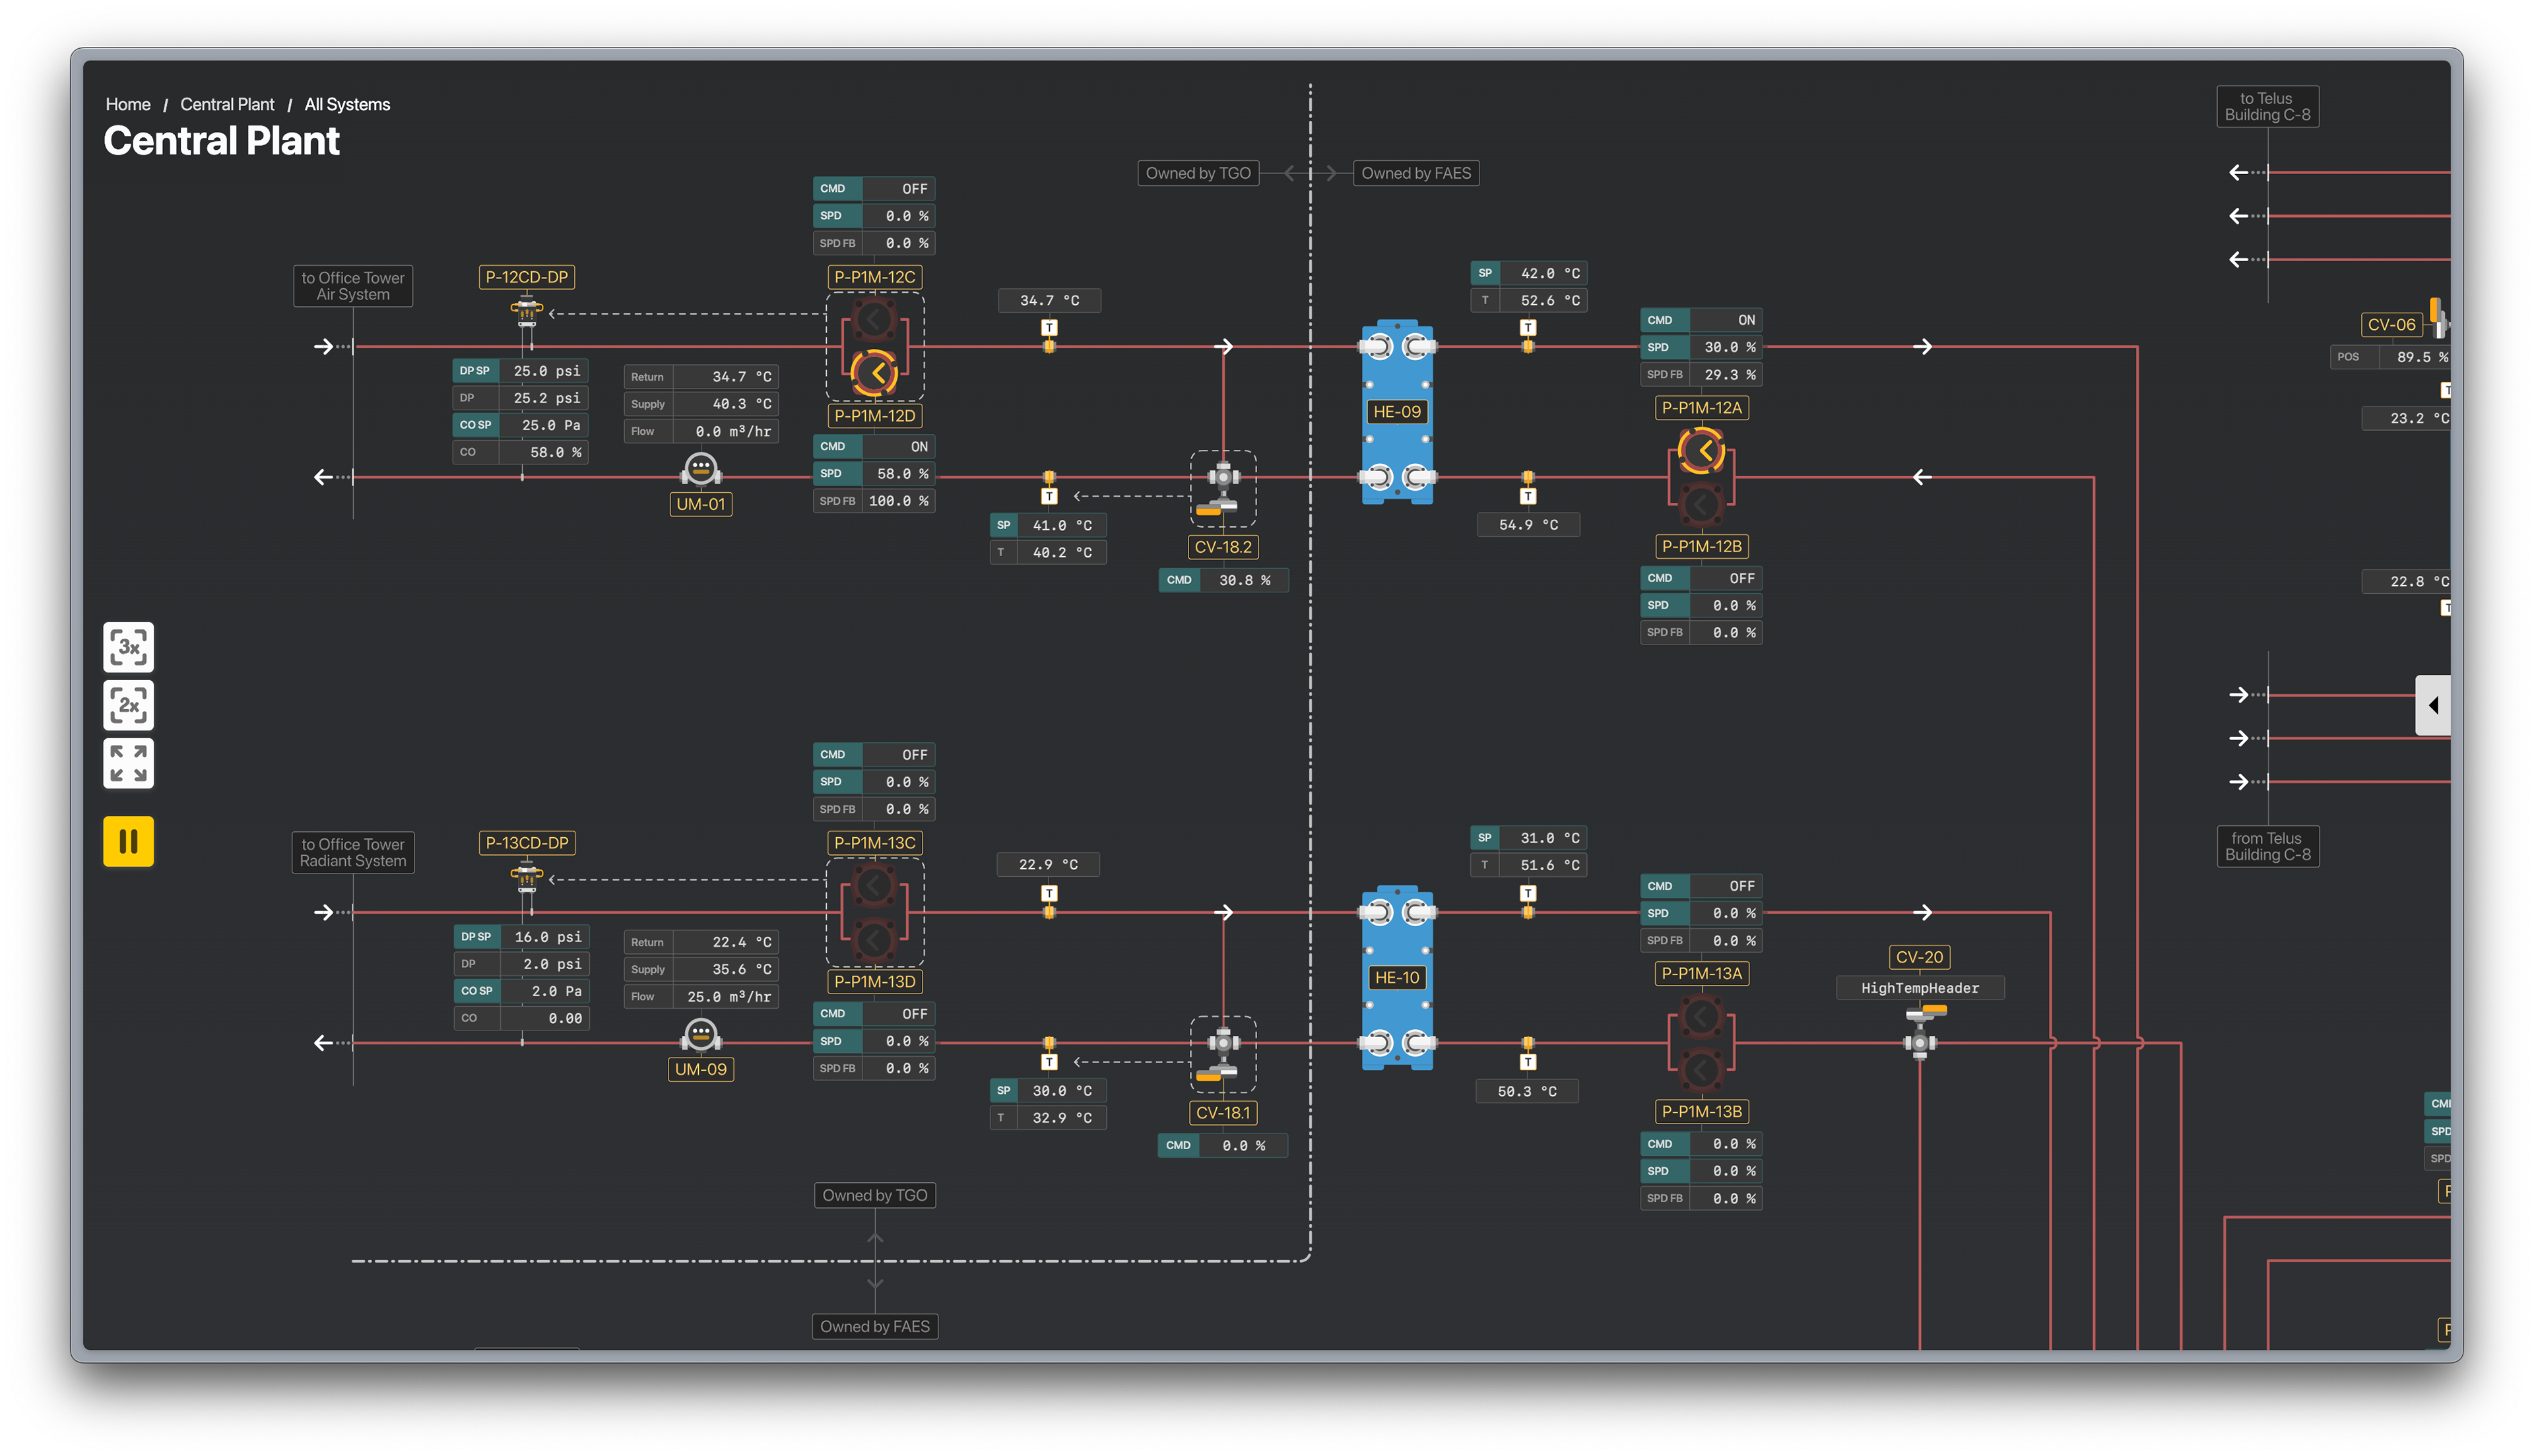
Screen capture: view showing clear division between load side (TGO, GR) and supply side (FortisAES)