Concept for University of Toronto in Mississauga energy management dashboard. Proposed in 2018, this was a demonstration of how energy metering and BIM information could influence energy usage throughout the campus. Energy managers and building operators can view the different sections to better understand instantaneous demand for power. Real time values shown are from a demo database. All artwork and front end development done by Aji Camua.
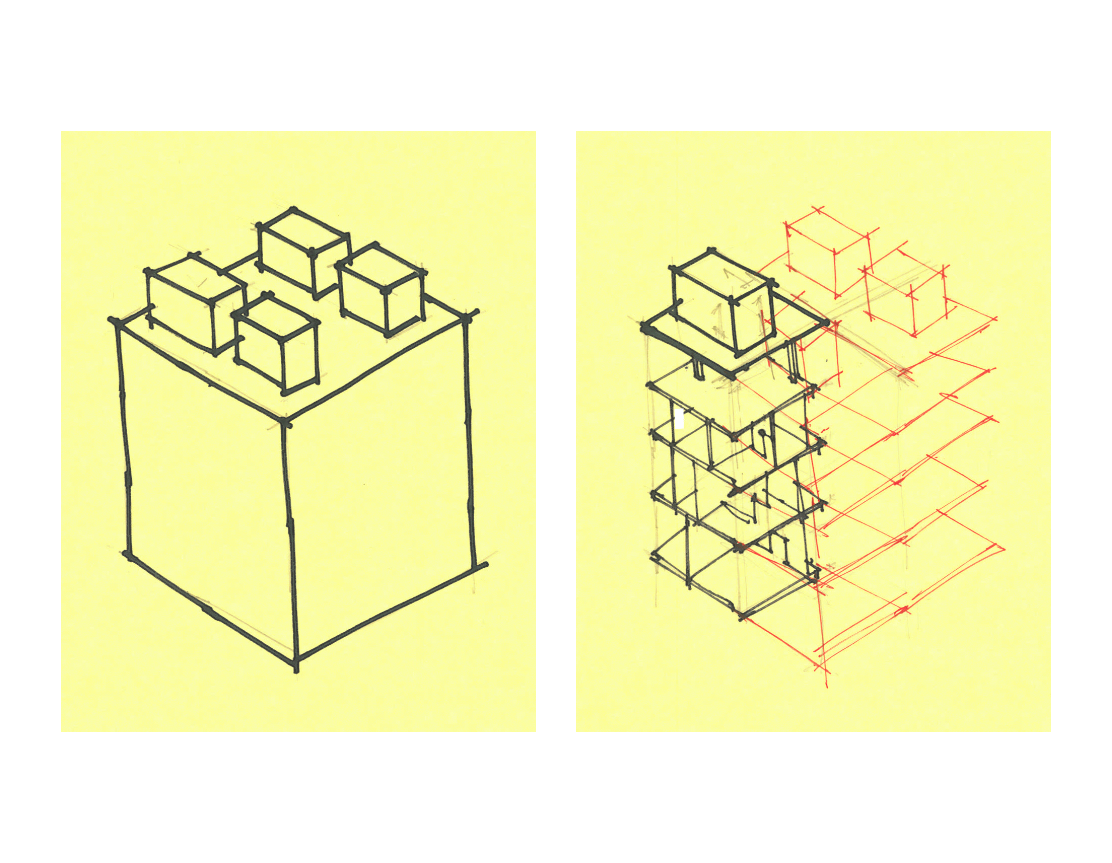
Concept art illustrating the four major AHUs serving the building.
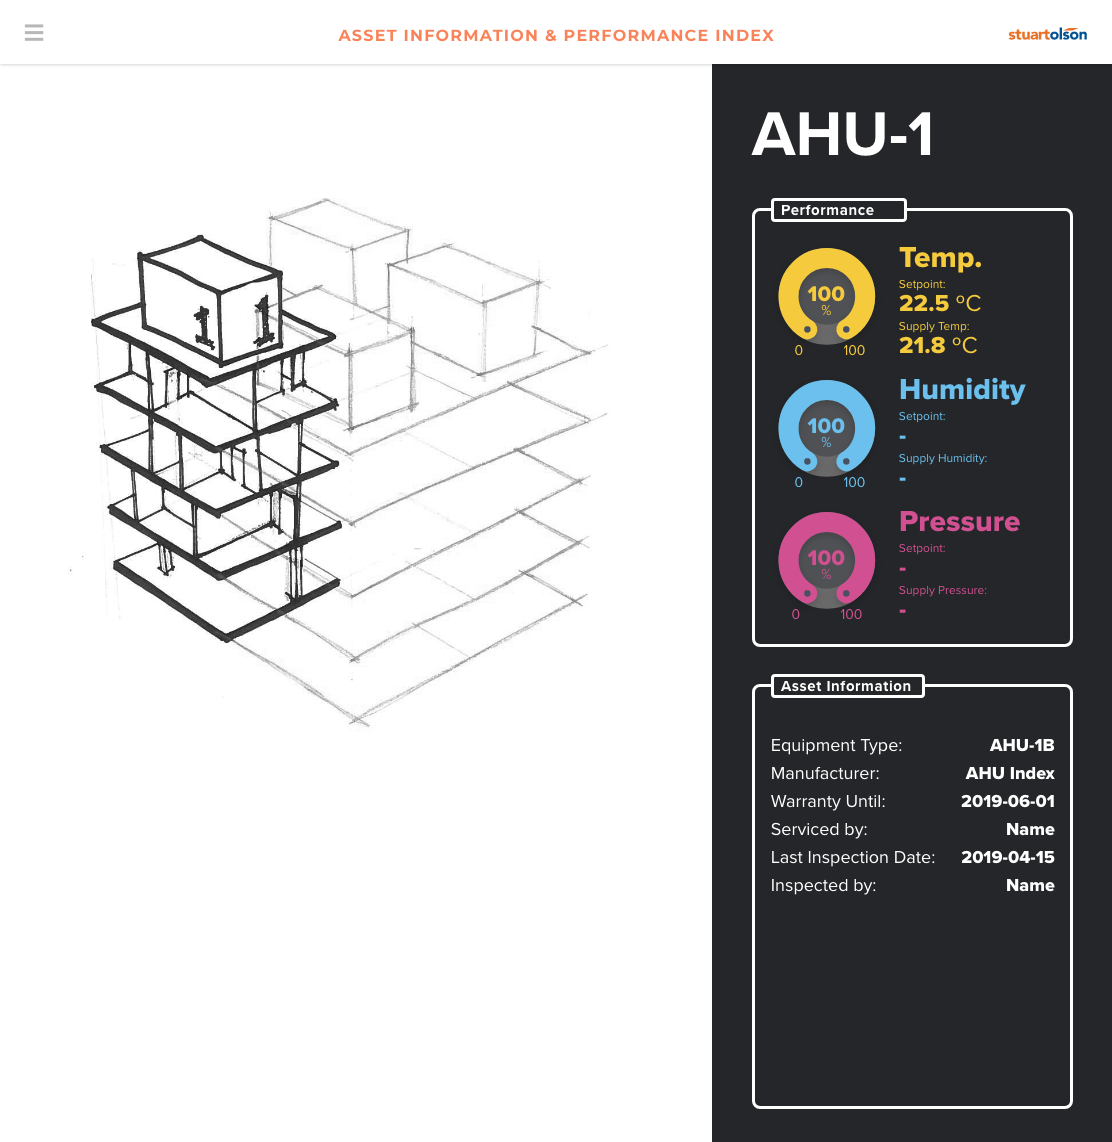
Concept art shown with UI mockup
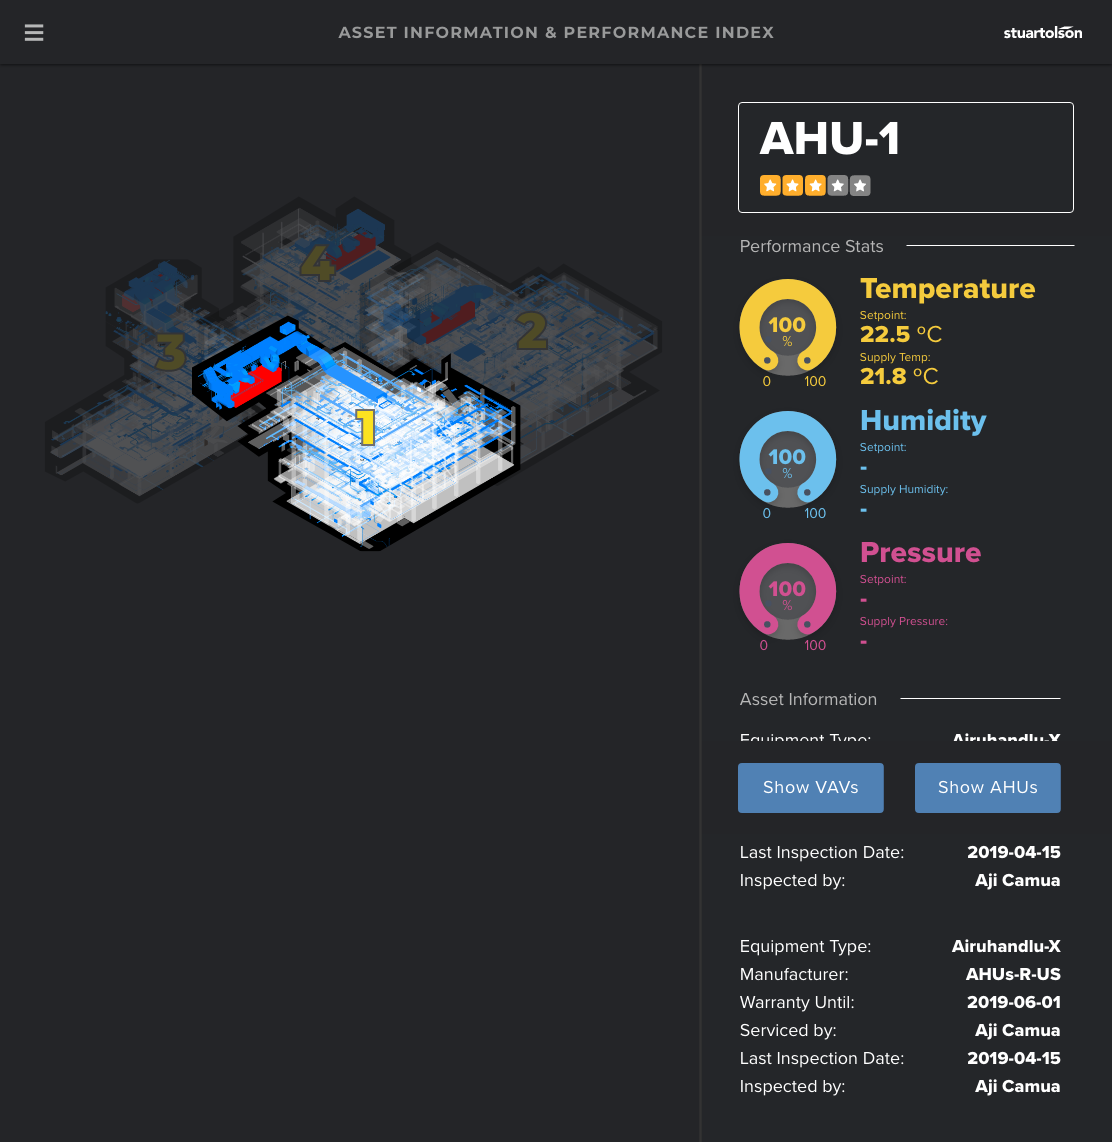
BIM exports (Revit) shown with UI mockup.
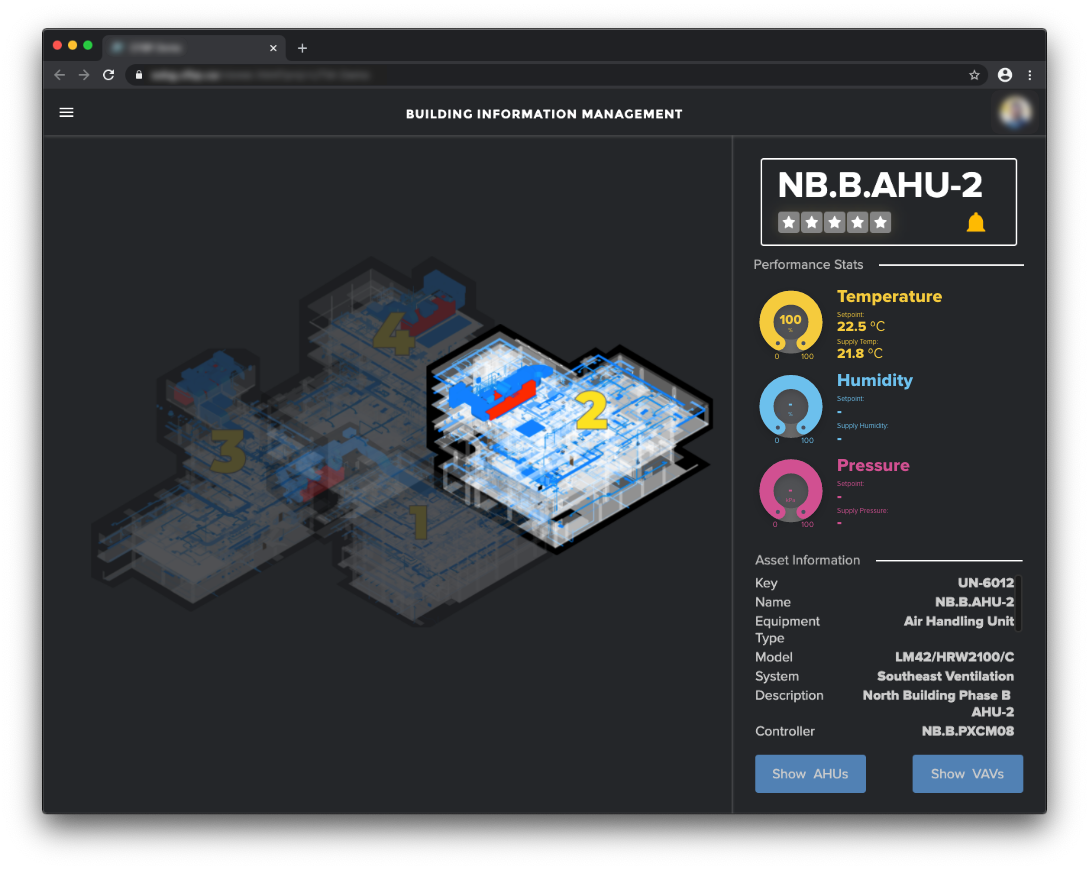
BIM data with Revit 3D images shown in demo UI using live AHU data.